The Royals 2021 offense by the numbers
Once again, the Royals lineup produced below the league average. Today, a look at five statistics that tell the story of how they got there.
It’s been awhile since the Royals have had a lineup that could be described as better than league average. How long? According to Fangraphs w(RC+) and Baseball Reference (OPS+), the last time was 10 years ago, back in 2011.
In fact, in the Dayton Moore Era, the Royals offense has usually run a little on the cold side when compared to its major league peers. The 2011 season is the only time since Moore joined the club that the Royals have had an above-average offense.
Thus, the offensive story was very familiar in 2021. There were some bright spots, but even the brightest couldn’t paper over the deficiencies. Add everything together and the 2021 Royals lineup finished with an 89 wRC+ and an 88 OPS+. Their 4.23 runs scored per game was below the league average, but right in line with what we’ve seen over the last 15 years with the current front office regime.
How did the Royals get here? I’m glad you asked! Let’s dive into some numbers.
32%
When a runner reached base for the Royals, he came around to score 32 percent of the time.
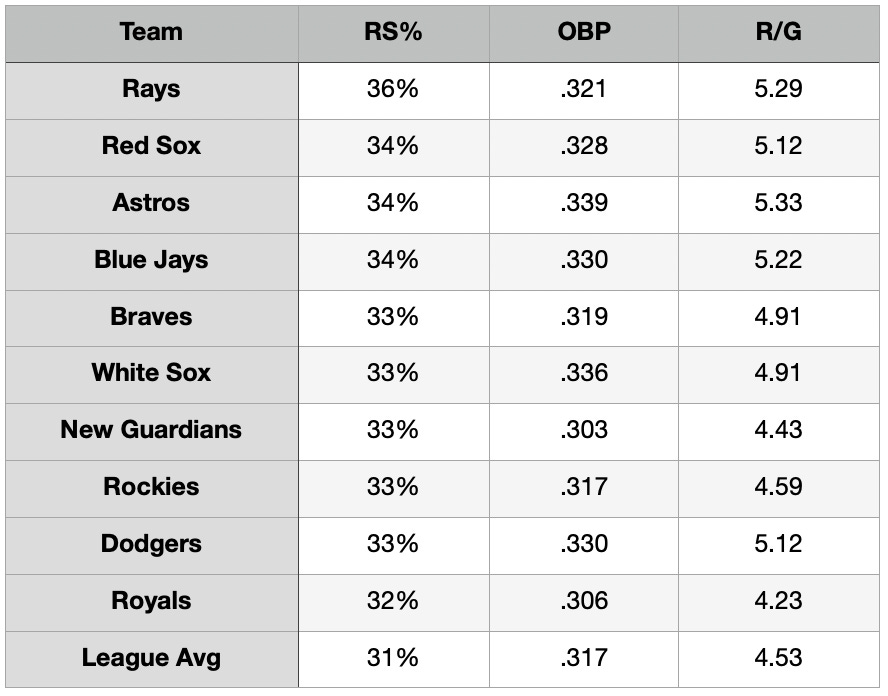
That’s a nice rate. A point about the league average of 31 percent. You won’t be surprised by this because, you know, scoring runs is how you win games, but the teams that had the highest percentage of baserunners scored, did kind of well this year.
Of the nine teams with a higher baserunner scored percentage than the Royals, six of them are in the postseason. A seventh, the Blue Jays, missed by a single game on the season’s final day. Another, the Rockies, tend to skew every offensive stat, rate and otherwise. The New Guardians, as you will see in a moment, mirrored the Royals. In quite a few ways.
Let’s expand the table a bit to get a further understanding of how, while the Royals did well to turn runners into runs, there’s still a ways to go.
While the Royals (and the New Guardians) both were better than league average at bringing around baserunners to score, they were well below the league average in someting kind of important…getting those actual runners on base. So the Royals did quite well to average those 4.23 runs per game, given what they had to work with. Imagine how much better the offense would’ve been had they just been able to get on base at a league average clip. Most of those teams in the table above averaged close to five runs per game because they could get runners on base.
To paraphrase Dani Rojas… OBP is life!
.647
Right field was the second-most productive position in the majors this summer, if you’re going by OPS. The average team’s posted a .774 OPS from the right field position. Not the Royals. Their collective OPS for right fielders in 2021 was .647, dead last in the majors. In fact, there were only five teams in baseball with an OPS lower than .700 from their right fielders.
The Royals had seven players generate at least one plate appearance as a right fielder in 2021. Six of them, posted on OPS below .700, no matter the sample size.
The production at the position is skewed by some absolute MVP candidates like Bryce Harper and Juan Soto. Don’t forget Ronald Acuña and Aaron Judge and Nick Castellanos. Still, the Royals were an offensive black hole at the position for most of the season. The irony is Jorge Soler moved to Atlanta as a replacement for the injured Acuña and posted an .859 OPS in 50 games. That would’ve helped.
Bonus numbers! -11 and -16
I know this entry is about the offense, but the above numbers dovetail nicely about the right field OPS from above. This is the Outs Above Average and Defensive Runs Saved, respectively, for Royals right fielders in 2021. The -11 OAA rate is the worst for all 30 teams for right fielders while the -16 DRS is just second-worst. (The Pirates right fielders were kind of grim defensively as well.)
The point is, right field wasn’t just an issue for the Royals in 2021. It was a massive, drive a semi-truck through, gigantic, completely humongous issue. As such, it’s one the Royals need to address. Recall that at the start of the season, the position was supposed to belong to Merrifield. And then Mondesi was injured and the domines tumbled. In one way it worked out (Merrifield played a fine second base and Lopez was stellar at short), but it did expose the lack of depth and options for the corner outfield.
28
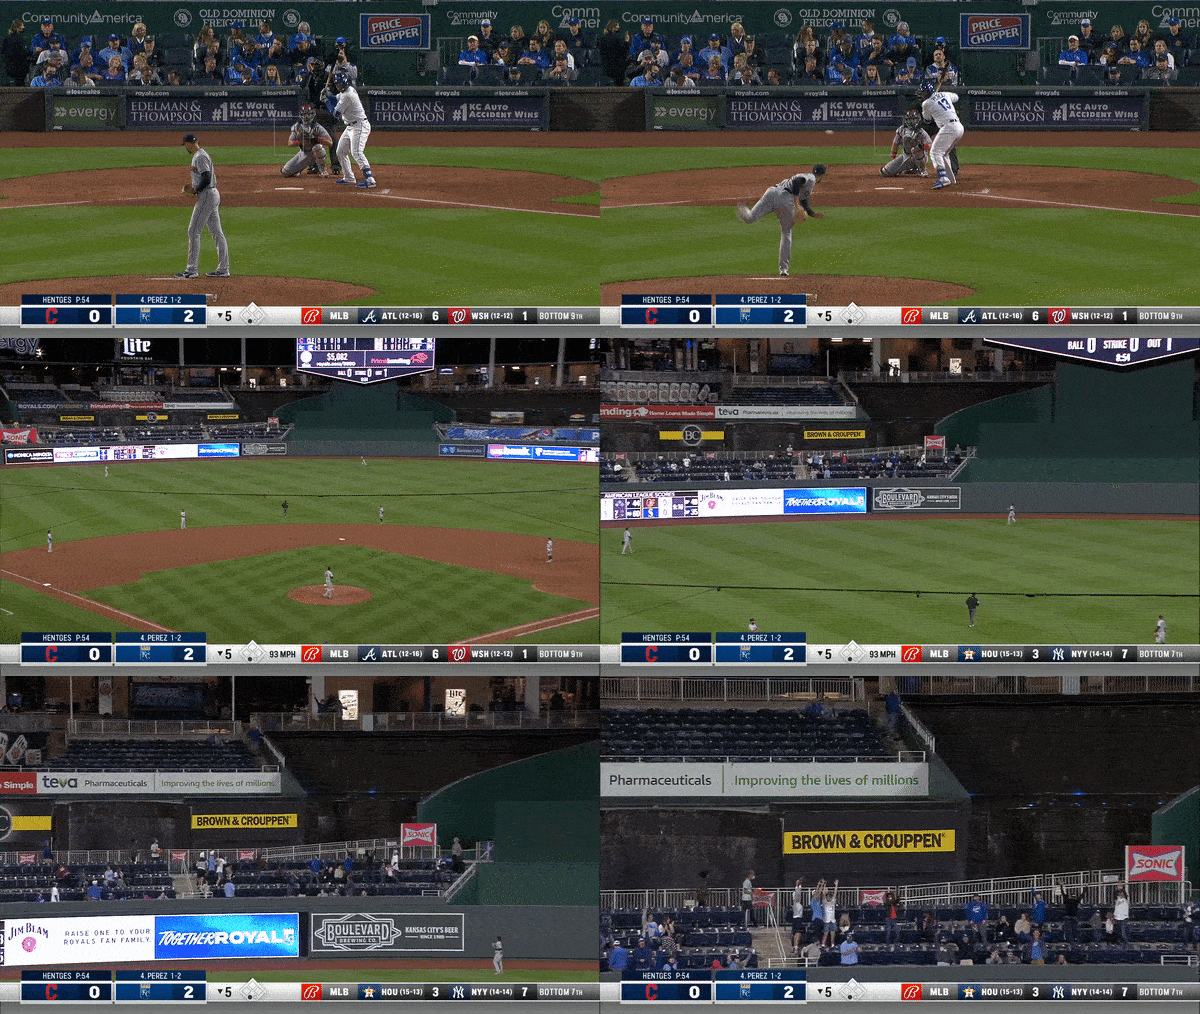
The number of “no doubter” home runs hit by Salvador Perez. That number led the majors. A “no doubter” home run is defined by Baseball Savant as a homer that would’ve left all 30 major league stadiums.
Like this…
Basically, when the hometown announcers would marvel at how Perez was managing to hit so many dingers, despite playing half his games at the expanse known as Kauffman Stadium, he kind of took power into his own hands to make certain he wasn’t cheated.
Perez’s expected home run total (xHR) was just 51.4. His difference of three home runs between expected and actual was only the 19th largest in baseball. You want to know a couple of players who were robbed as the year went along? How about Andrew Benintendi at -6 with an xHR of 23.3, Carlos Santana at -5 with an xHR of 24.3 and Hunter Dozier, also at -5 with an xHR of 21.2. Perez lost a couple dingers to The K, but it wasn’t as many as you probably thought.
184
That’s the total number of Productive Outs the Royals made according to Baseball Reference. That tally led the majors by a wide margin.
(A Productive Out is defined by B-R as a successful sacrifice by a pitcher with one out, advancing any runner with none out or scoring a runner with the second out of the inning.)
Watch any Royals broadcast and you’re certain to hear the announcers extoll the virtues of the productive out. It would appear the Royals take that to heart. Their Productive Out % (the percentage of successful opportunities converted) was 32.6 percent. The Royals were the only team in the majors with a Productive Out percent greater than 30 percent.
I guess a productive out is better than a non-productive out. (Say, a strikeout with a runner on third with less than two outs.) But at the end of the day, a team only gets 27 outs. (Unless it’s a Rob Manfred special doubleheader. Those come with six fewer outs. But I digress.) Their 52 sacrifice flies were second-most in the majors, behind only the Astros with 54. Their 31 sacrifice bunts were the most in the AL. And then there were the other advances that come with the general aggressive base running the Royals employ.
Speaking of that base running…
7.4%
You knew this was coming…One of my favorite stats because it’s always relevant about the Royals is stolen base attempt percentage. This is the percentage of times a team tries to steal a bag when they are presented with an opportunity as defined by Baseball Reference. (The opportunity is a plate appearance where a runner is on first or second and the next base is open.) The Royals, as you are not surprised to hear, run a lot. Their 7.4 percent stolen base opportunity rate was the highest in the majors.
Just five teams tried to steal in more than six percent of their opportunities.
What made this an ideal situation for the Royals is the fact they (and really all the top teams) were really good at swiping a base. You know all about Nicky Lopez and how he was caught stealing only once all year (in the season’s final series!), going 22 for 23. Whit Merrifield was exceptional as well, swiping 40 bags in 44 attempts. Adalberto Mondesi only appeared in 35 games but somehow managed to steal 15 bases in 16 attempts.
Being aggressive on the bases is in the Royals team DNA. This was one year where that aggression was a net positive for the offense.


Who do you want playing right field in 2022 since it was such a void in 2021? How many more games would a league average fielder/hitter combination have won the Royals in 2021?