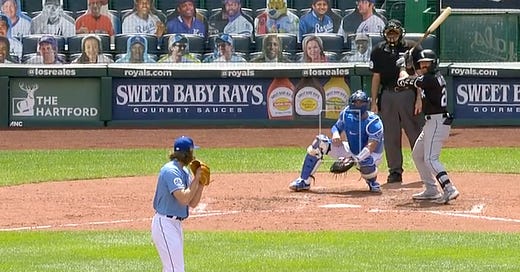
Like all managers, Mike Matheny has relievers he will turn to with great frequency. Not a closer or a set-up man necessarily—defined roles are unnecessary. Just a reliever who the manager feels he can depend upon to get outs. He believes this reliever can deliver the required results. Call it the Bullpen Circle of Trust.
Scott Barlow occupies the bullseye smack in the center of Mike Matheny’s Bullpen Circle of Trust.
No reliever was summoned in 2020 more than Barlow, his 32 appearances leading the majors. He repaid that trust generally with success—an 11.7 SO/9, a 2.7 BB/9 but with an ERA of 4.20.
Barlow’s trouble outings followed a specific pattern. A base hit, or two, followed by a dinger. Nine of his 14 runs allowed in 2020 came via the home run. Another two came when he left a game after allowing two singles to open what was his second inning of work and Greg Holland allowed those inherited runners to score.
(Lordy, I dislike the looks of making excuses for relievers who allow runs. But especially after a shortened 2020 season where we’re dealing with an extra-small sample size, it almost seems necessary. But let’s not forget, relievers will give up runs. It happens. You just can’t look at a handful of outings and proclaim, “If he didn’t give up a home run his ERA would be 1.22!” But in this case, I found Barlow’s pattern somewhat striking.)
Overall in 2020, Barlow allowed four home runs, for a 1.2 HR/9 rate. Four dingers over a 60 game season isn’t a lot—one every 15 games—and we’re certainly not veering into Ian Kennedy territory here, but make no mistake, it was an issue for Barlow.
Last year, opposing batters hit .333 against Barlow’s fastball. With an xBA of .336 it looks like that batting average against was legit. The slugging percentage against his heater was…concerning. At a .667 SLG, Barlow surrendered three of those four home runs on fastballs.
If you recall my attempt at physics yesterday in discussing Josh Staumont, we might make the same argument that a high-velocity pitch results in high-velocity contact. Barlow throws hard for sure—he averaged 94.9 mph on his fastball—and his 95th percentile on Whiff% is Staumontesque. So his 24th percentile on HardHit%. But the biggest hangup for Barlow is his location with the fastball.
There’s a ton of red in the hitter’s happy zone.
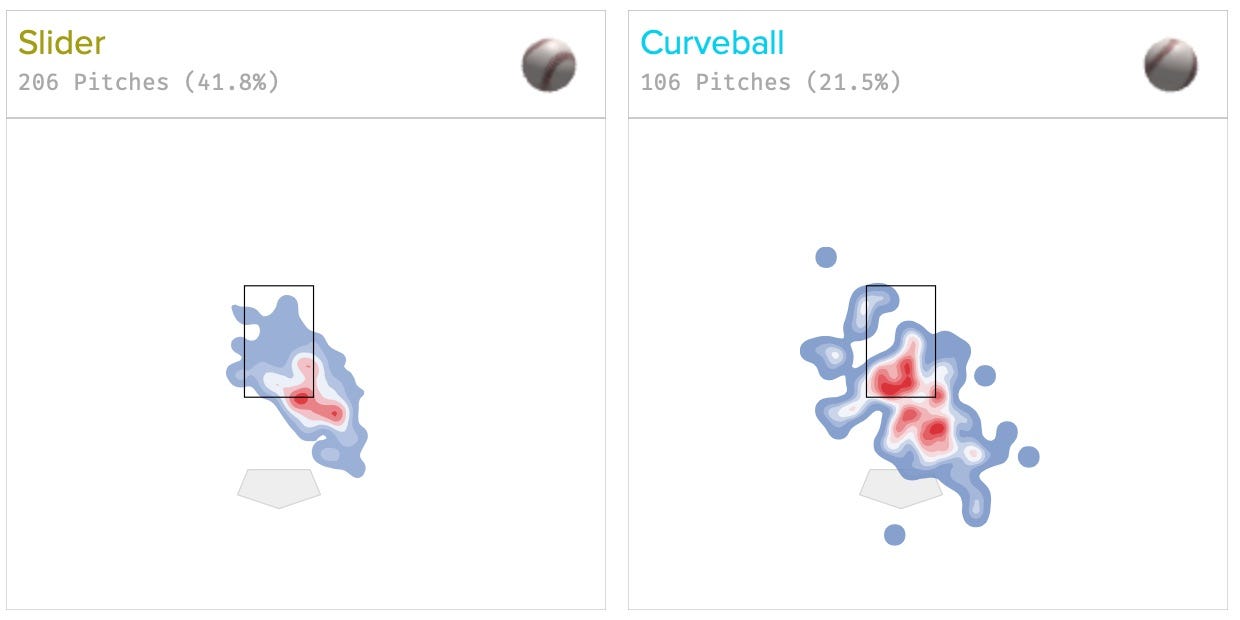
Barlow’s moneymaker comes from his breaking repertoire, namely his slider and curve. In 2020 he offered his slider just over 41 percent of the time—it was his most frequent pitch type. The curve was thrown just over 21 percent of the time. He generally locates both pitches well down in the zone.
Opposing batters hit .222 against Barlow’s slider and .143 versus his curve. With xBAs of .231 and .137 respectively we can say that, like with the fastball, he found honest results.
By throwing the slider more to right-handed hitters and with above-average lateral break of the curve breaking into the lefty, Barlow was able to keep most of the contact on those pitches on the ground.
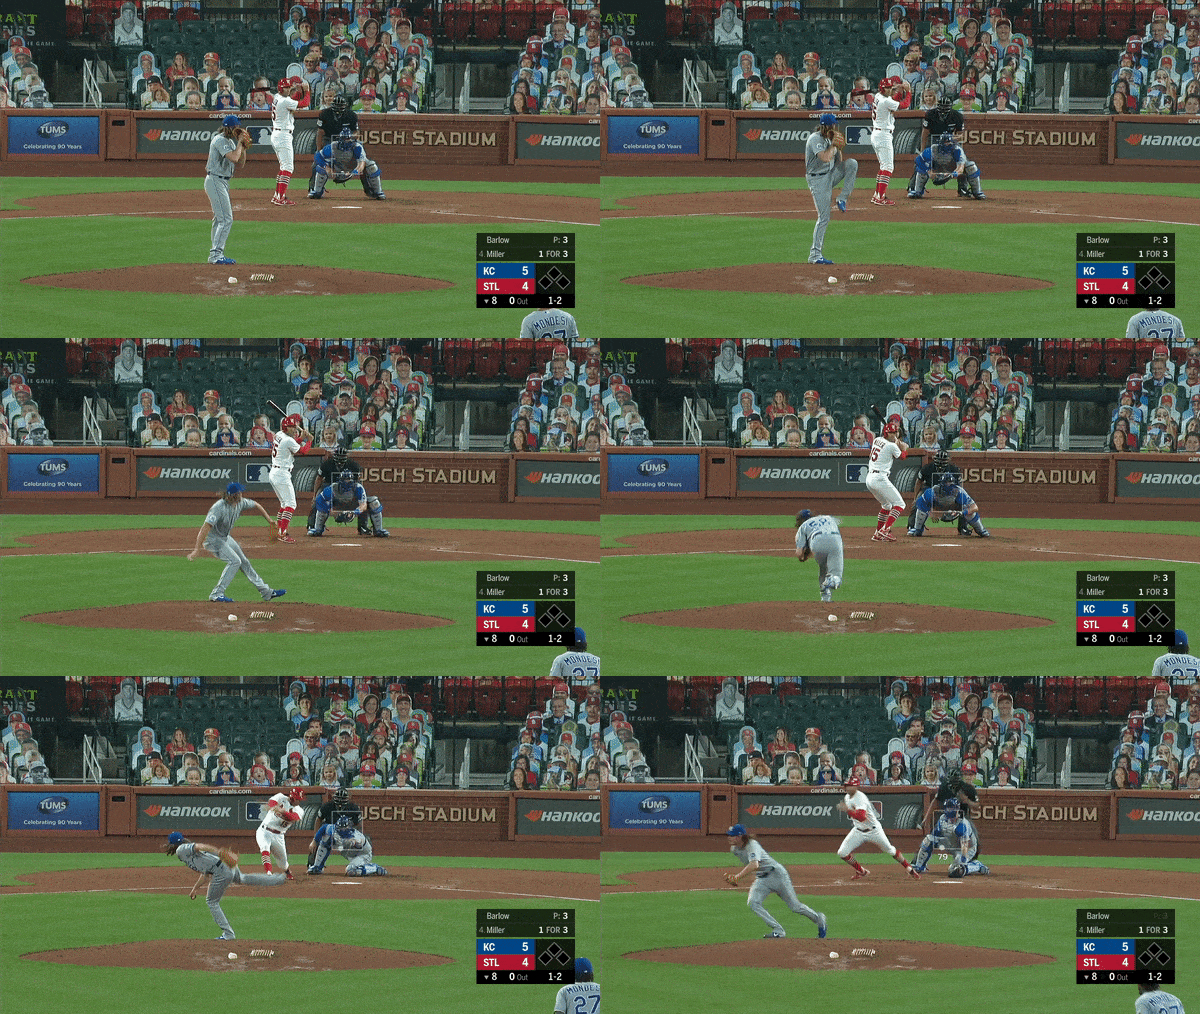
Here’s what it looks like when Barlow gets a right-handed hitter to chase the slider:
And a left-handed batter going after a curve in a similar location:
Barlow’s success stems from consistently keeping the hitters off-balance. He will throw any of his three pitches in any count. And while lefties will see more curves than right-handed hitters, he will still offer the curve enough to those same-side bats that they can’t rule out being aware of the pitch. The same goes for his slider, a pitch that Barlow has enough confidence in that he will throw in just about any count but most frequently when he is behind.
The Projections
THE BAT - 10.4 SO/9, 4.2 BB/9, 1.2 HR/9
PECOTA - 10.6 SO/9, 4.1 BB/9, 1.0 HR/9, 0.7 WARP
Steamer - 10.1 SO/9, 3.8 BB/9, 1.2 HR/9, 0.4 fWAR
ZiPS - 11.0 SO/9, 4.5 BB/9, 1.1 HR/9, 0.5 fWAR
Let’s use these projections to talk about the most positive development of Barlow’s 2020 season: He sliced his walk rate from 4.7 BB/9 in 70 innings of work 2019 to last season’s aforementioned 2.7 BB/9. Percentage-wise, the reduction of his walk rate by 4.7 percent was the eighth-best in all of baseball from 2019 to 2020. It’s a helluva reduction, but one the projections don’t buy. I think that may be a mistake.
He threw 47 percent of his pitches inside the zone in 2020 compared to 45 percent the previous year. He got more first-pitch strikes by about 1.3 percent so he was pitching ahead in the count from the jump a little more than the previous year. And his Whiff% was up by close to three percent. Small, positive movements seemed to make a large difference in that walk rate. The rest of his plate discipline numbers—contact rate, chase rate, swing rate—were all roughly the same from the previous year. He basically battled and made the pitches he needed to in a particular situation. So the question for Barlow heading into 2021 is, can he continue to locate in the zone? This seems to be the tipping point for him going forward. He did it before with such incremental movement, there’s really no reason to think he can’t do this in some fashion again. Maybe the walk rate goes up a bit. It’s just difficult to see it ballooning to a rate greater than 4 BB/9. But who knows? Relievers are a strange breed from season to season.
If the command is sticky, it’s easy to see Barlow remaining in Matheny’s Bullpen Circle of Trust. He’s a nice compliment to Staumont—not closer material per se, but versatile enough he can pitch in just about any inning and in any situation. In 2020 that meant generally anywhere from the sixth to the ninth innings with the ballgame within two runs or less. With a couple of save opportunities and some key holds, he had the fourth-highest Game Leverage Index (the opening Leverage Index for relievers, indicating pressure situations) behind Trevor Rosenthal, Greg Holland and Jesse Hahn.
The Royals bullpen has the potential to be a strength in 2021. Barlow’s performance will help determine that.


